Dashboard
A web-based dashboard is available in the @pg-boss/dashboard package for monitoring and managing jobs, queues and schedules.
Features
- Overview: Aggregate statistics, problem queues, and recent warnings at a glance
- Queue Management: View all queues with cached statistics and create new queues
- Job List: View jobs with state and queue filtering
- Job Details: View full job payloads, output data, and metadata
- Job Actions: Create, cancel, retry, resume, or delete jobs directly from the UI
- Warning History: When
persistWarningsis enabled, browse through previously emitted warning events - Multi-Schema Support: Monitor multiple pg-boss instances from a single dashboard
- Mobile Responsive: Full functionality on mobile devices with collapsible sidebar
- Shareable URLs: Database selection and filters are preserved in URLs for easy sharing
Pages
Overview
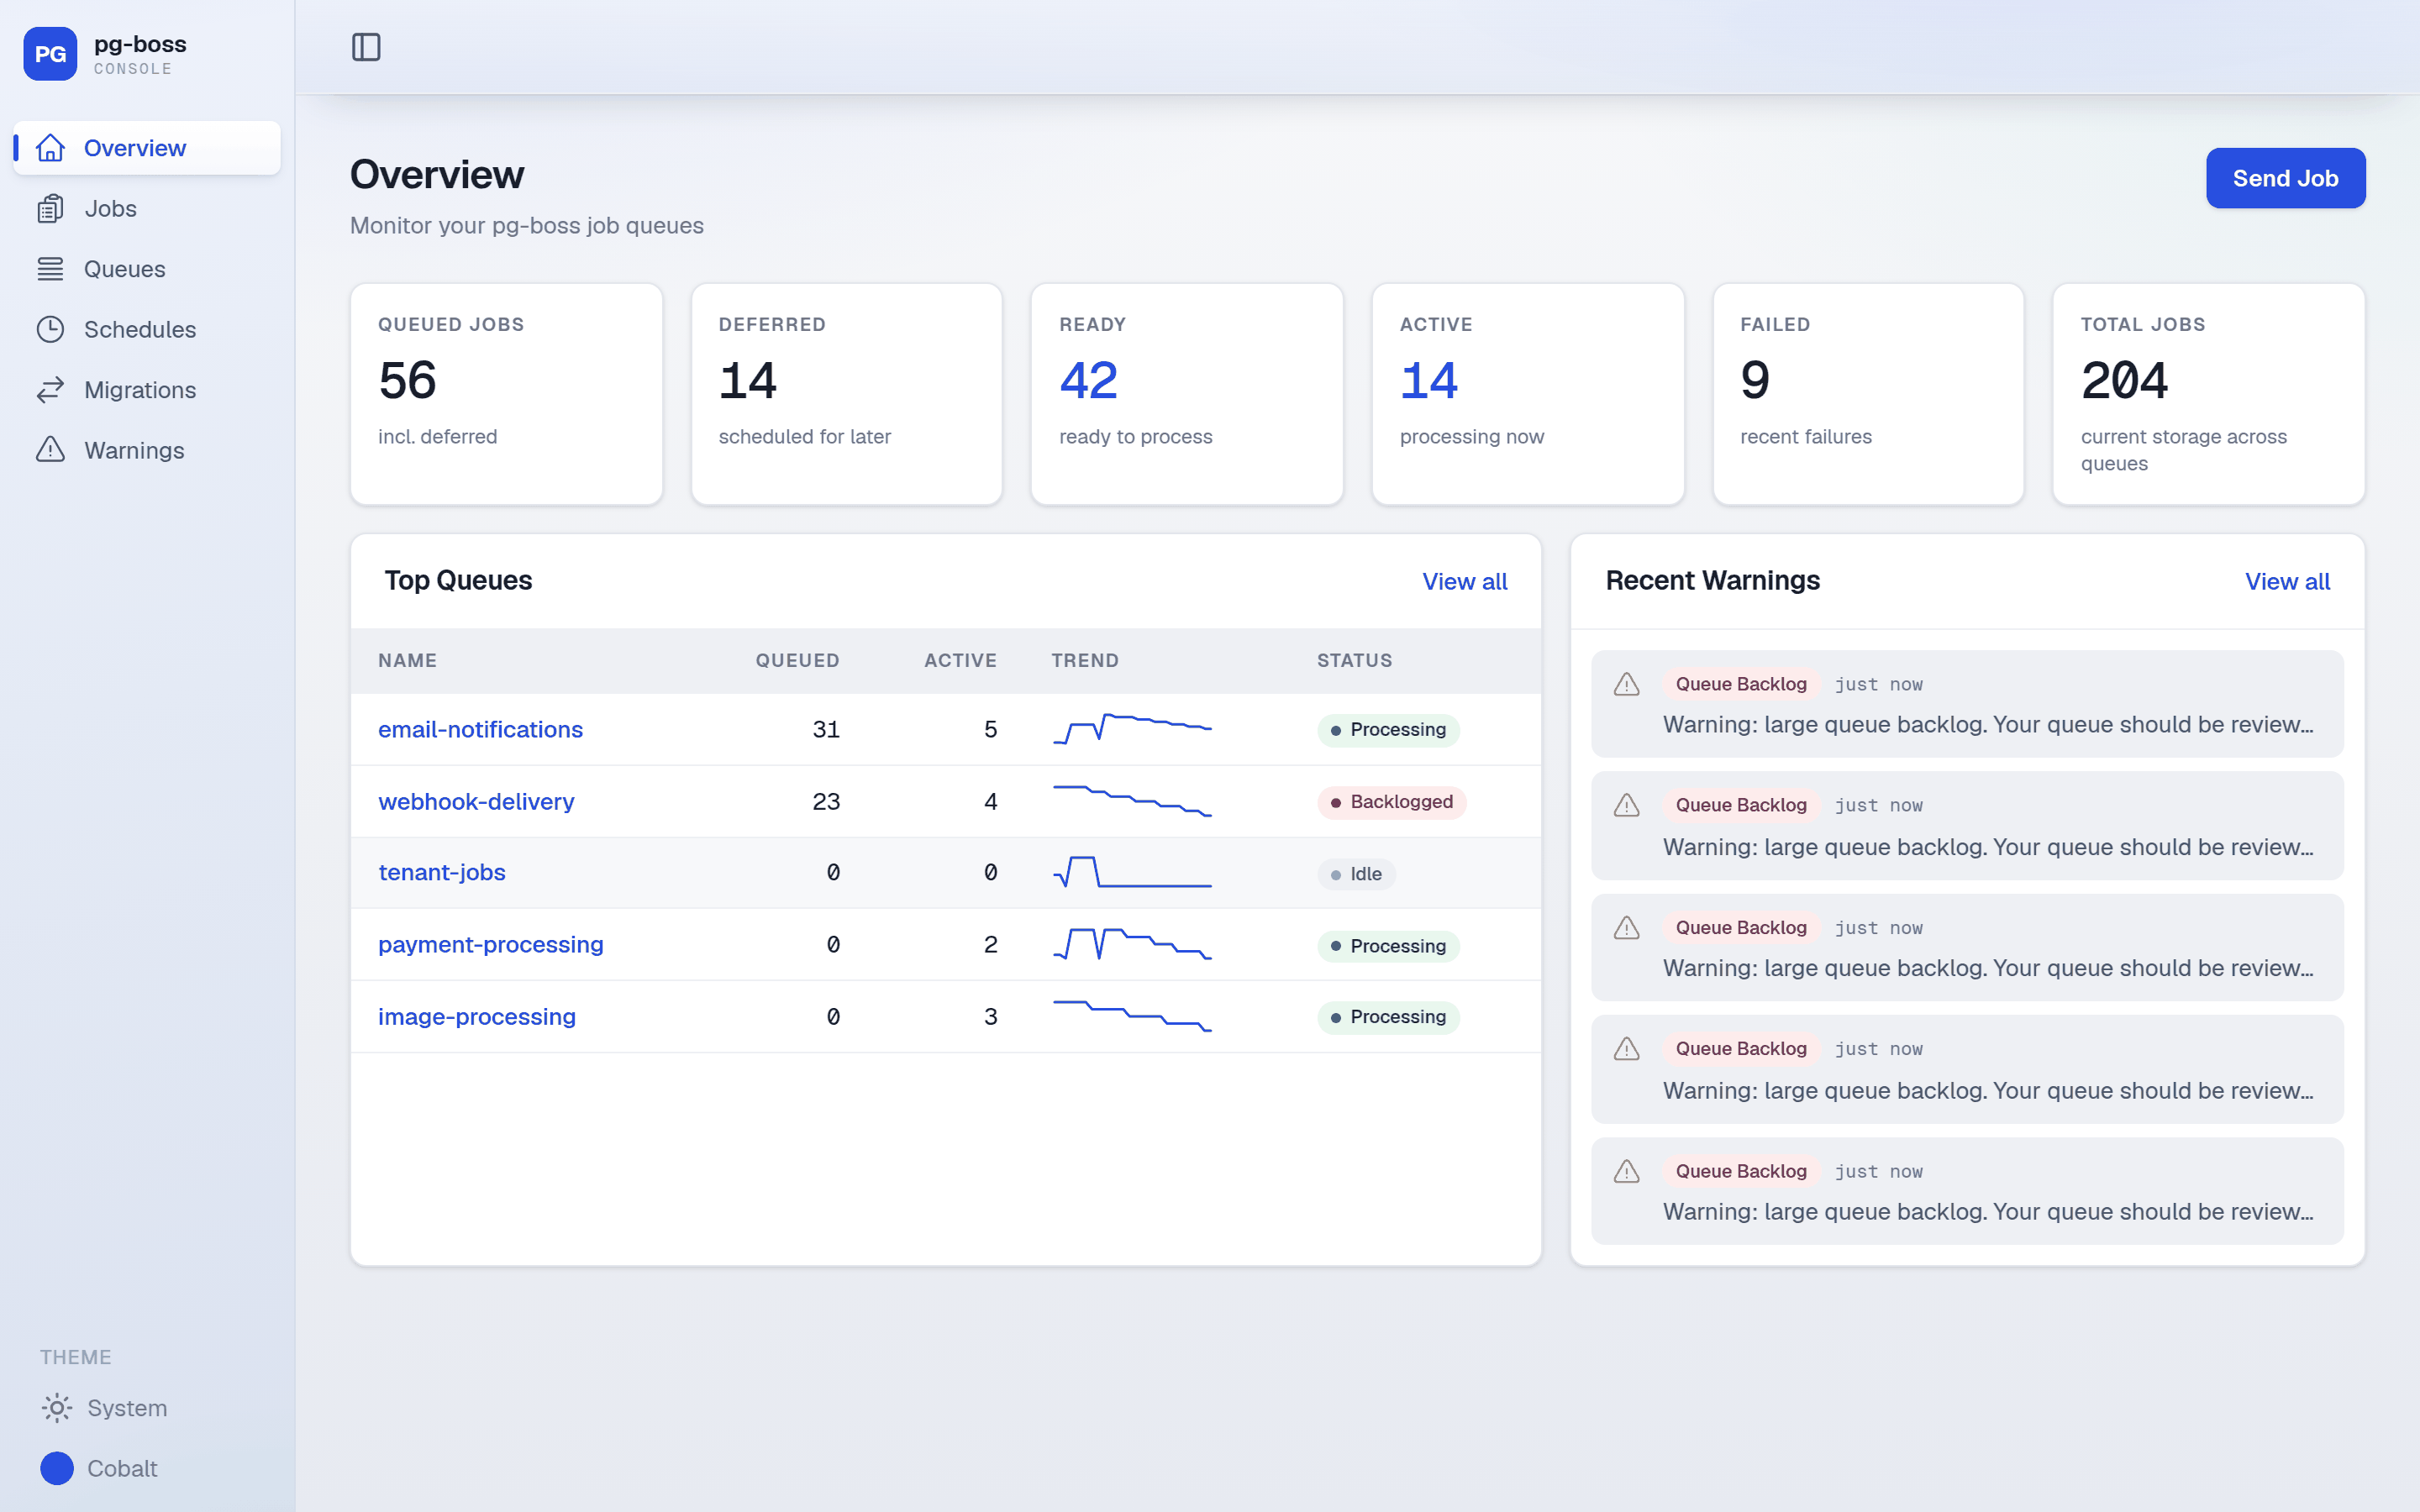
Landing page with aggregate counts across all queues (queued, deferred, ready, active, failed and total jobs), the top queues by backlog with a ready-count trend sparkline and status badge, and the most recent warnings. The Send Job button opens a form to enqueue a job into any queue.
Jobs
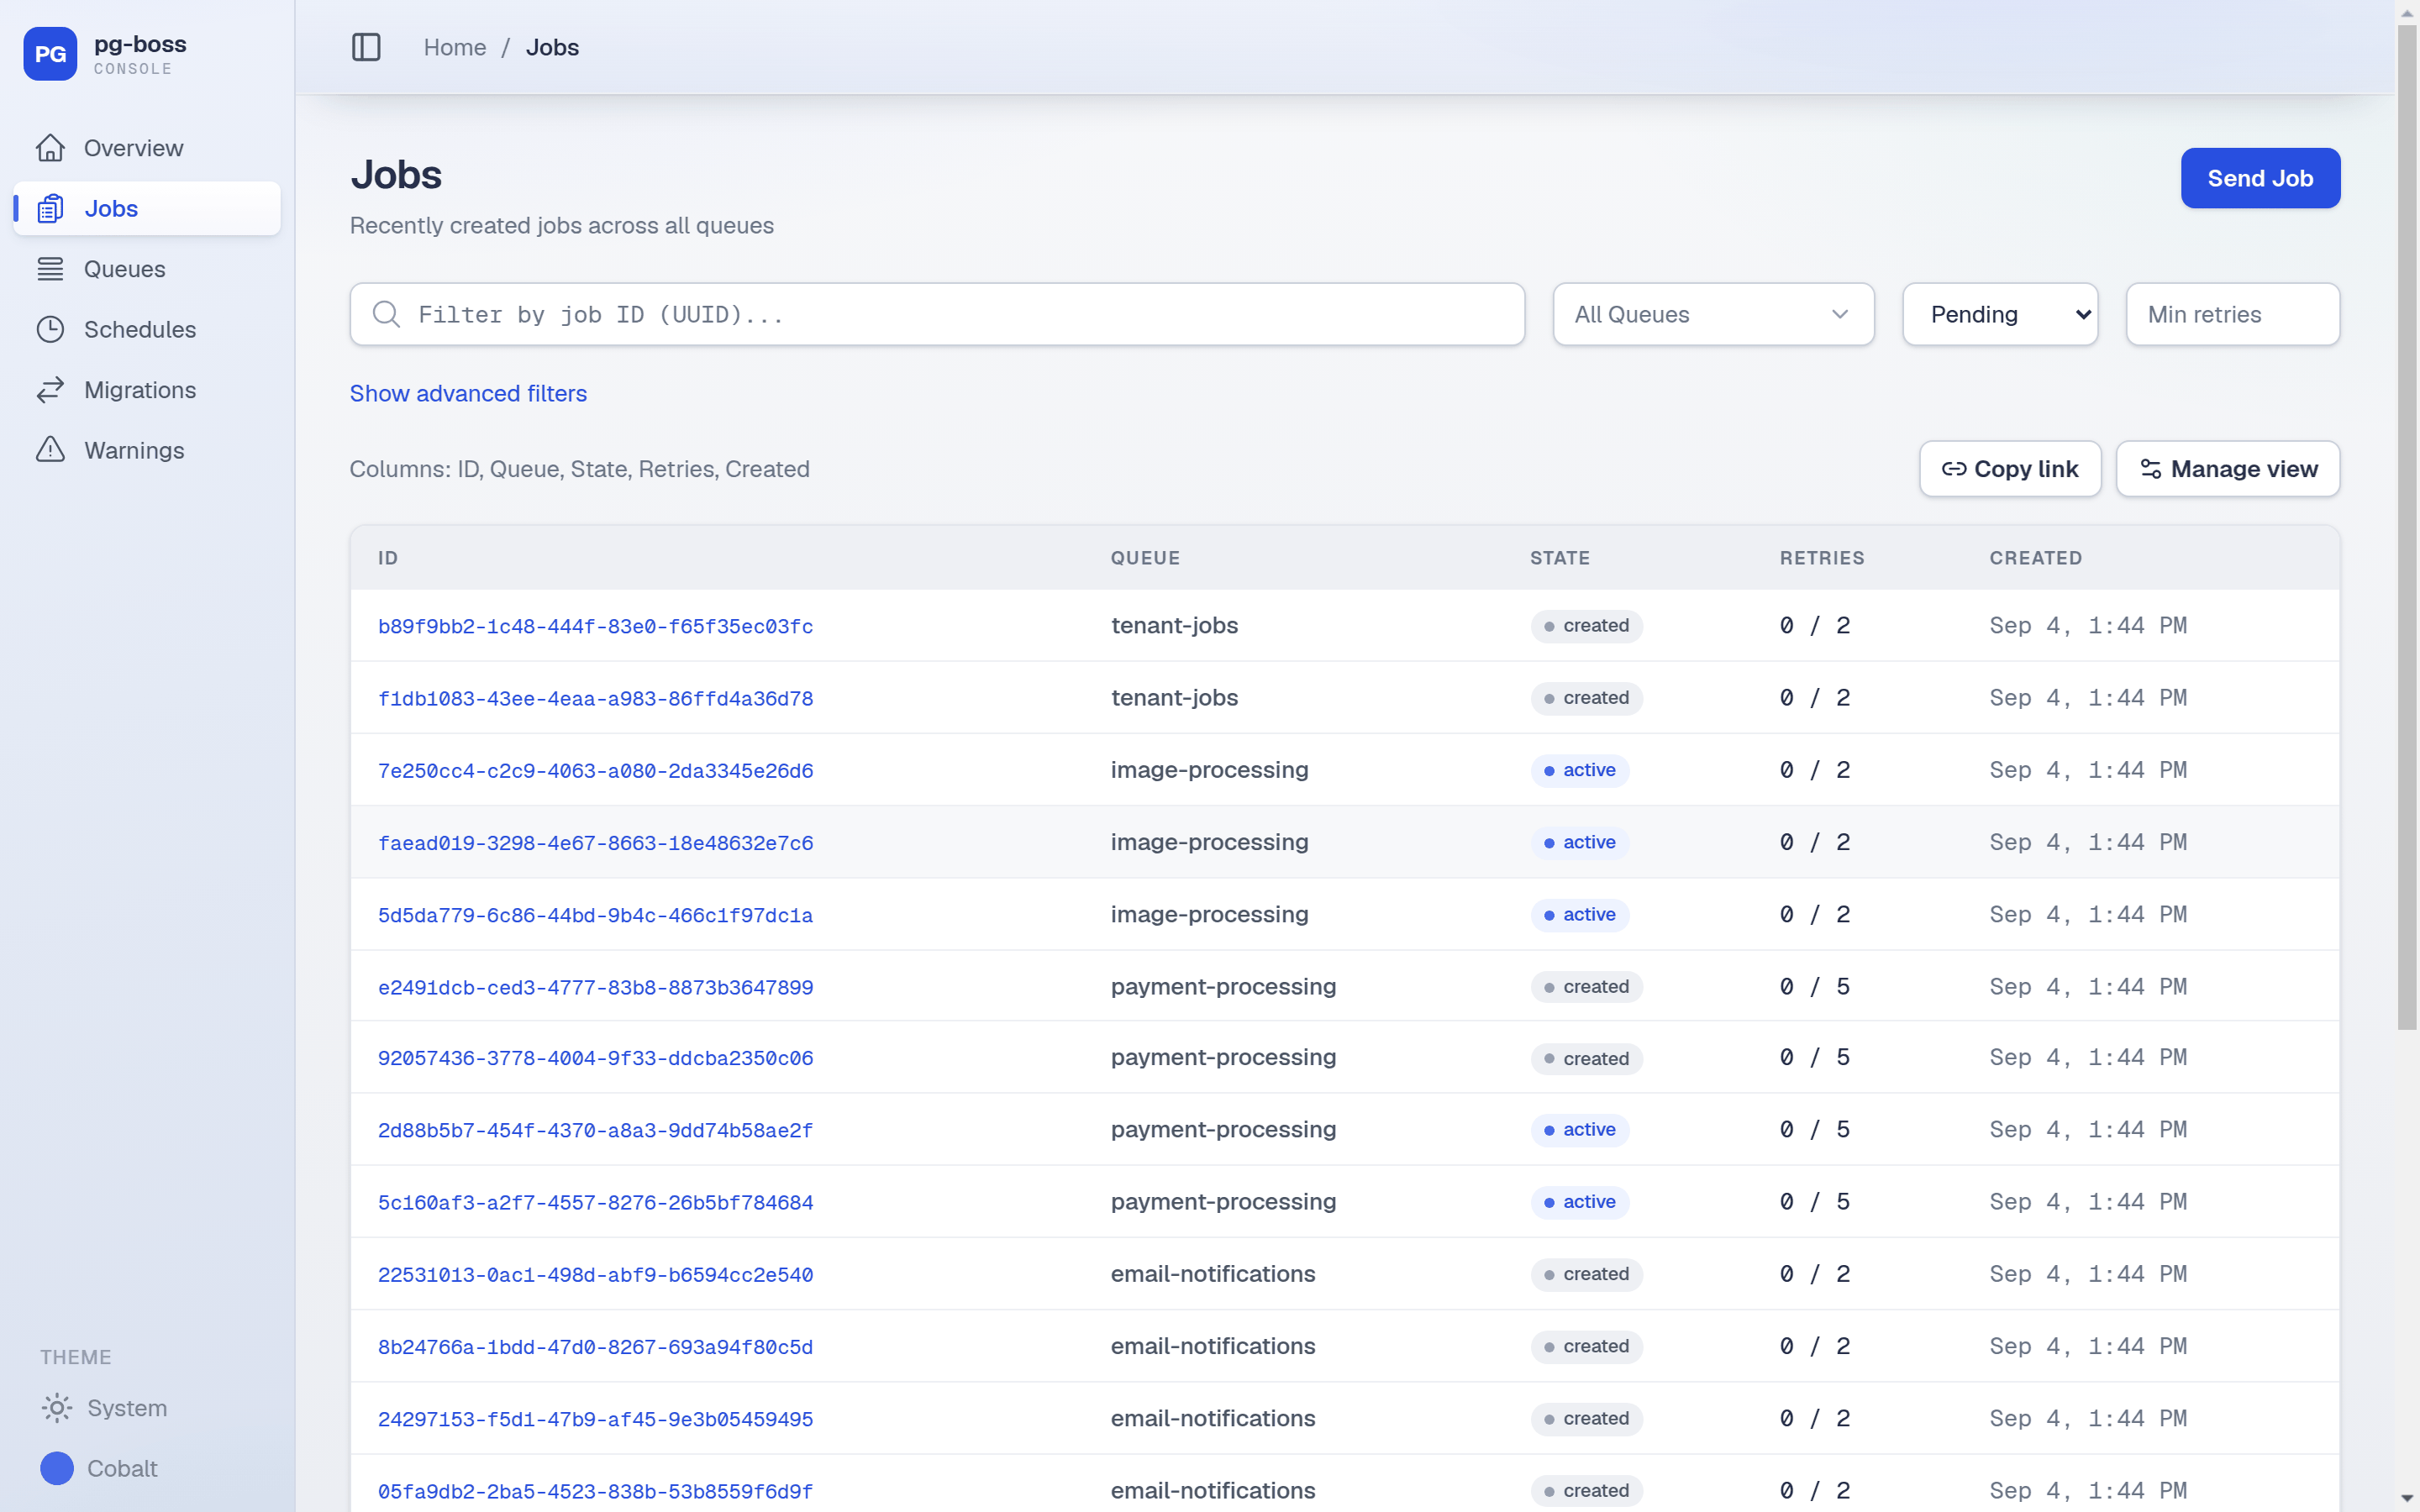
Recently created jobs across all queues. Filter by job ID, queue, state (pending, created, retry, active, completed, cancelled or failed) and minimum retry count, or open the advanced filters to match on keys inside the job's data or output JSON. Manage view lets you add custom columns sourced from job fields (for example data.tenantId), and Copy link produces a shareable URL with the current filters and columns. Clicking a job opens its detail page with the full payload, output, retry and timing metadata, and cancel / retry / resume / delete actions.
Queues
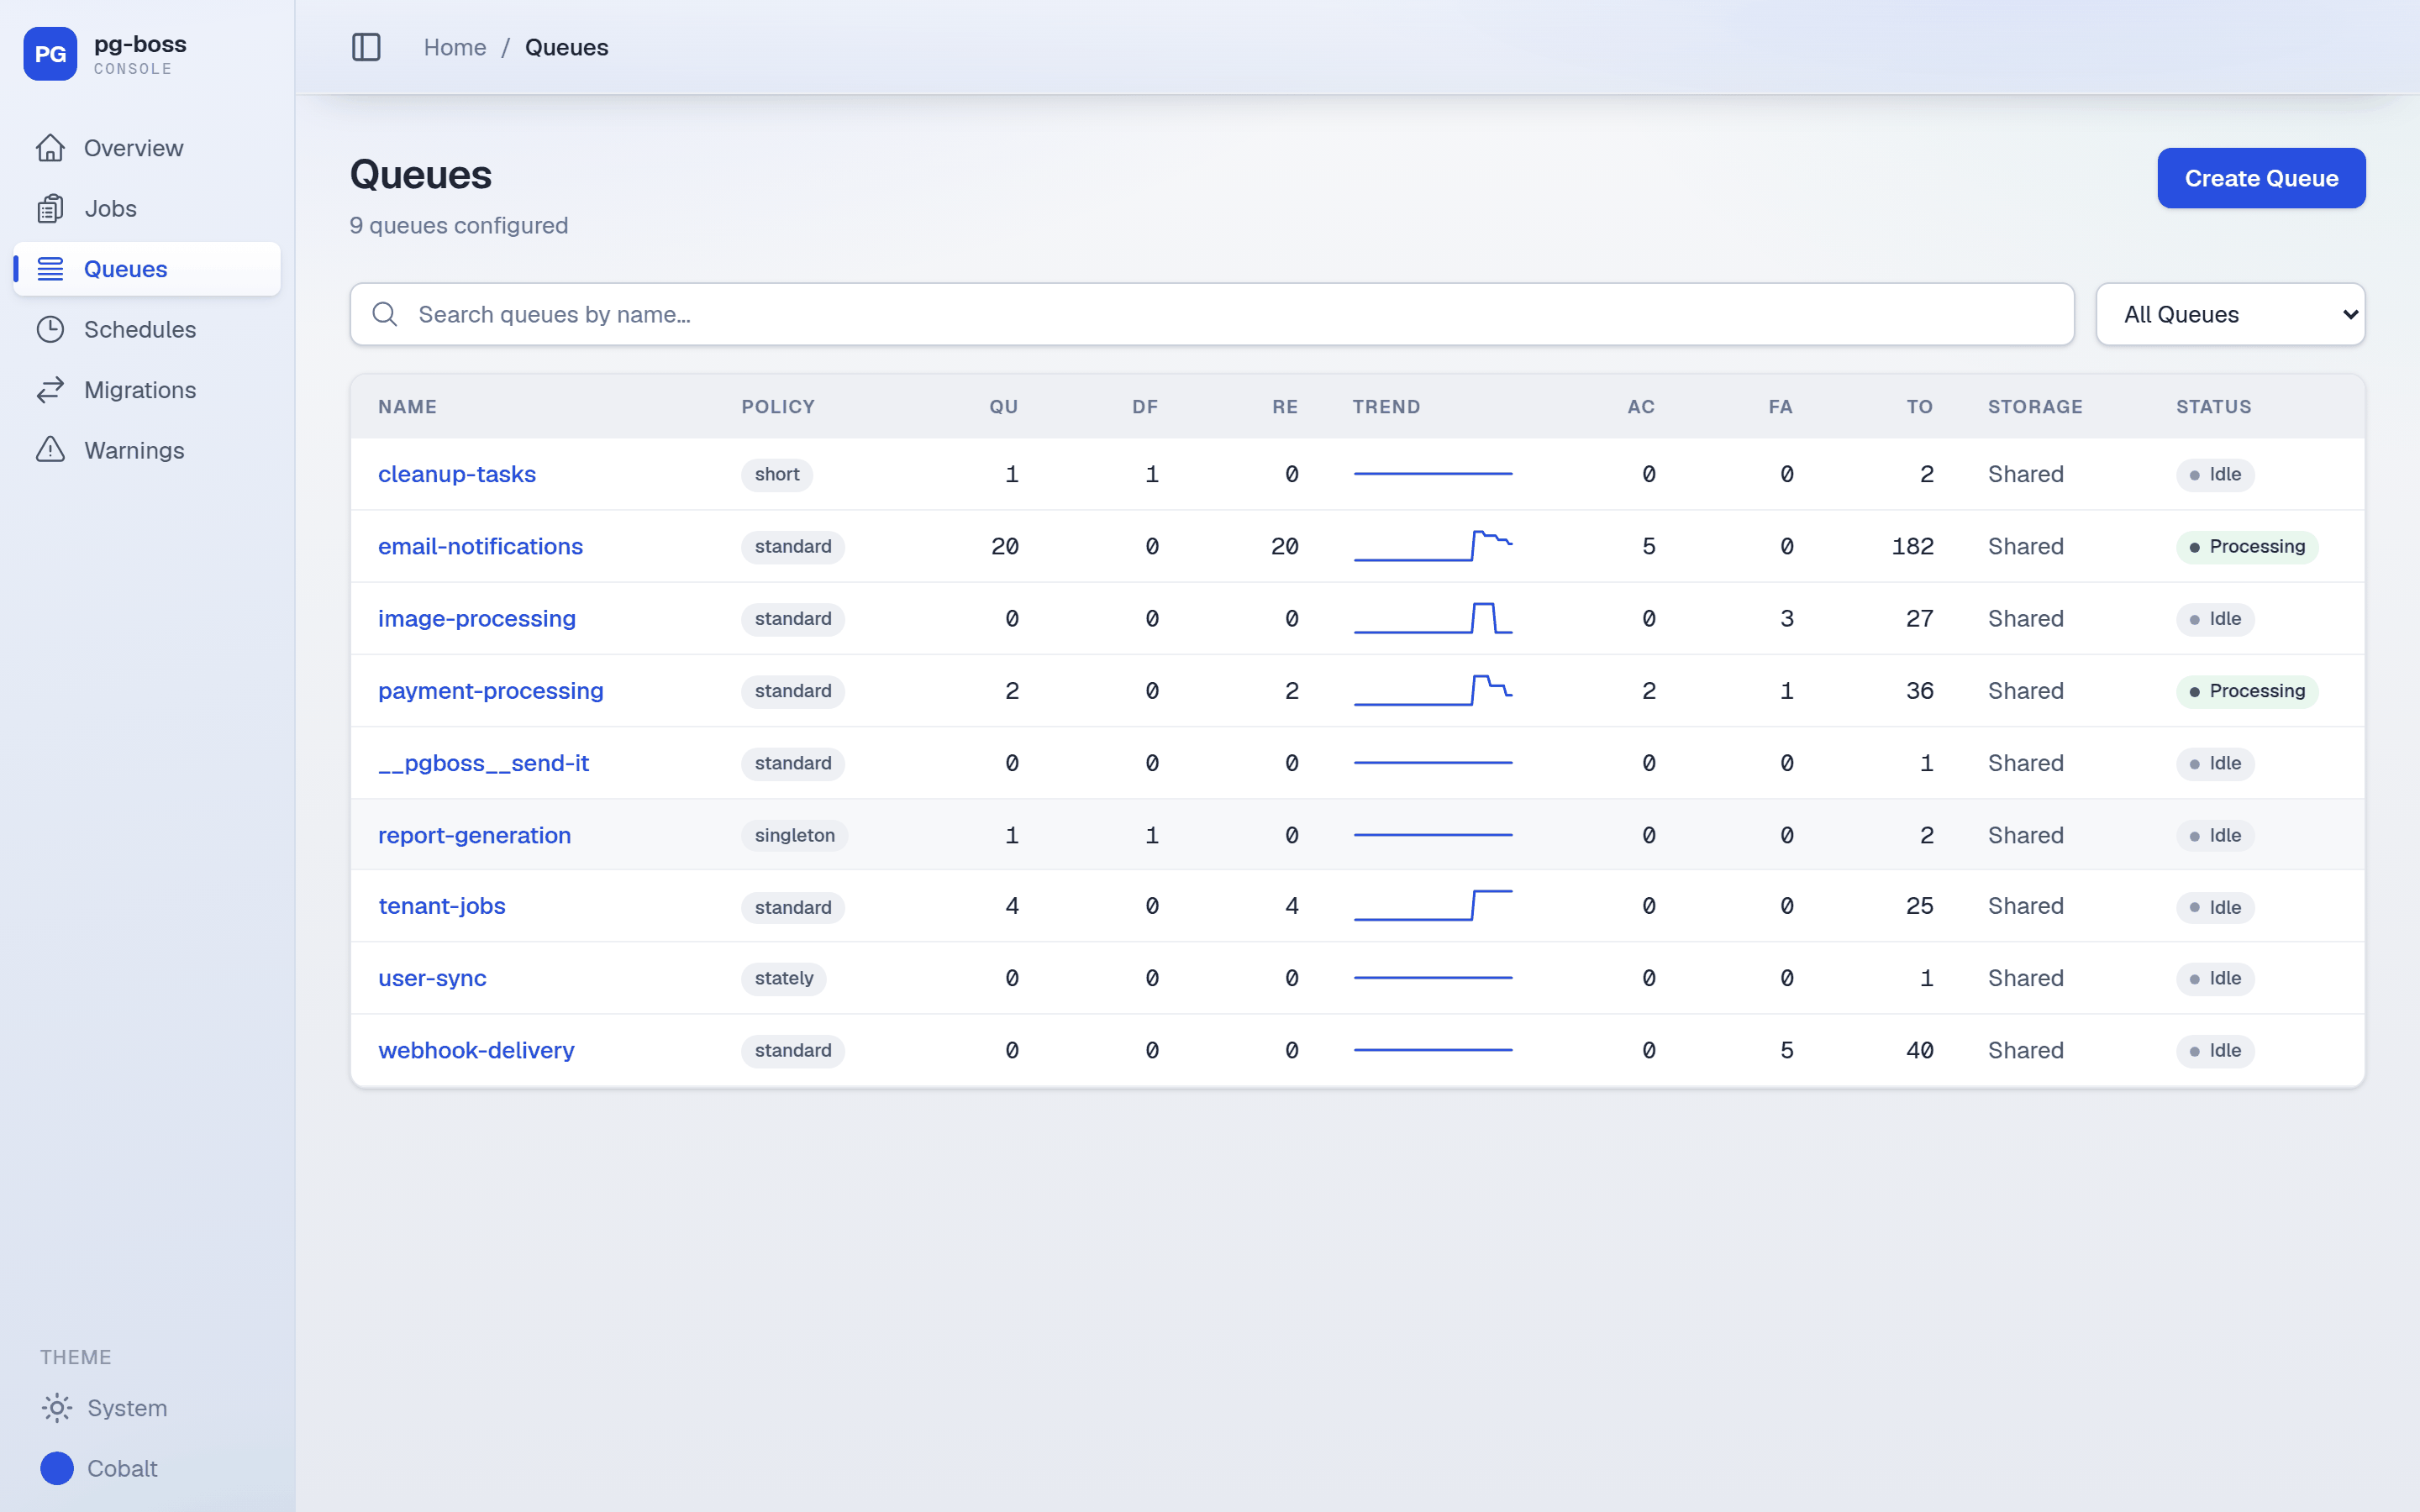
Every queue in the schema with its policy and cached counts (queued, deferred, ready, active, failed, total), a trend sparkline, storage mode (shared or partitioned) and a status badge (idle, processing or backlogged). Columns are sortable and the list can be searched by name. Create Queue creates a new queue with its policy and retry / expiration / retention options. Clicking a queue opens its detail page with configuration, a 24-hour ready-count history and the jobs in that queue.
Schedules
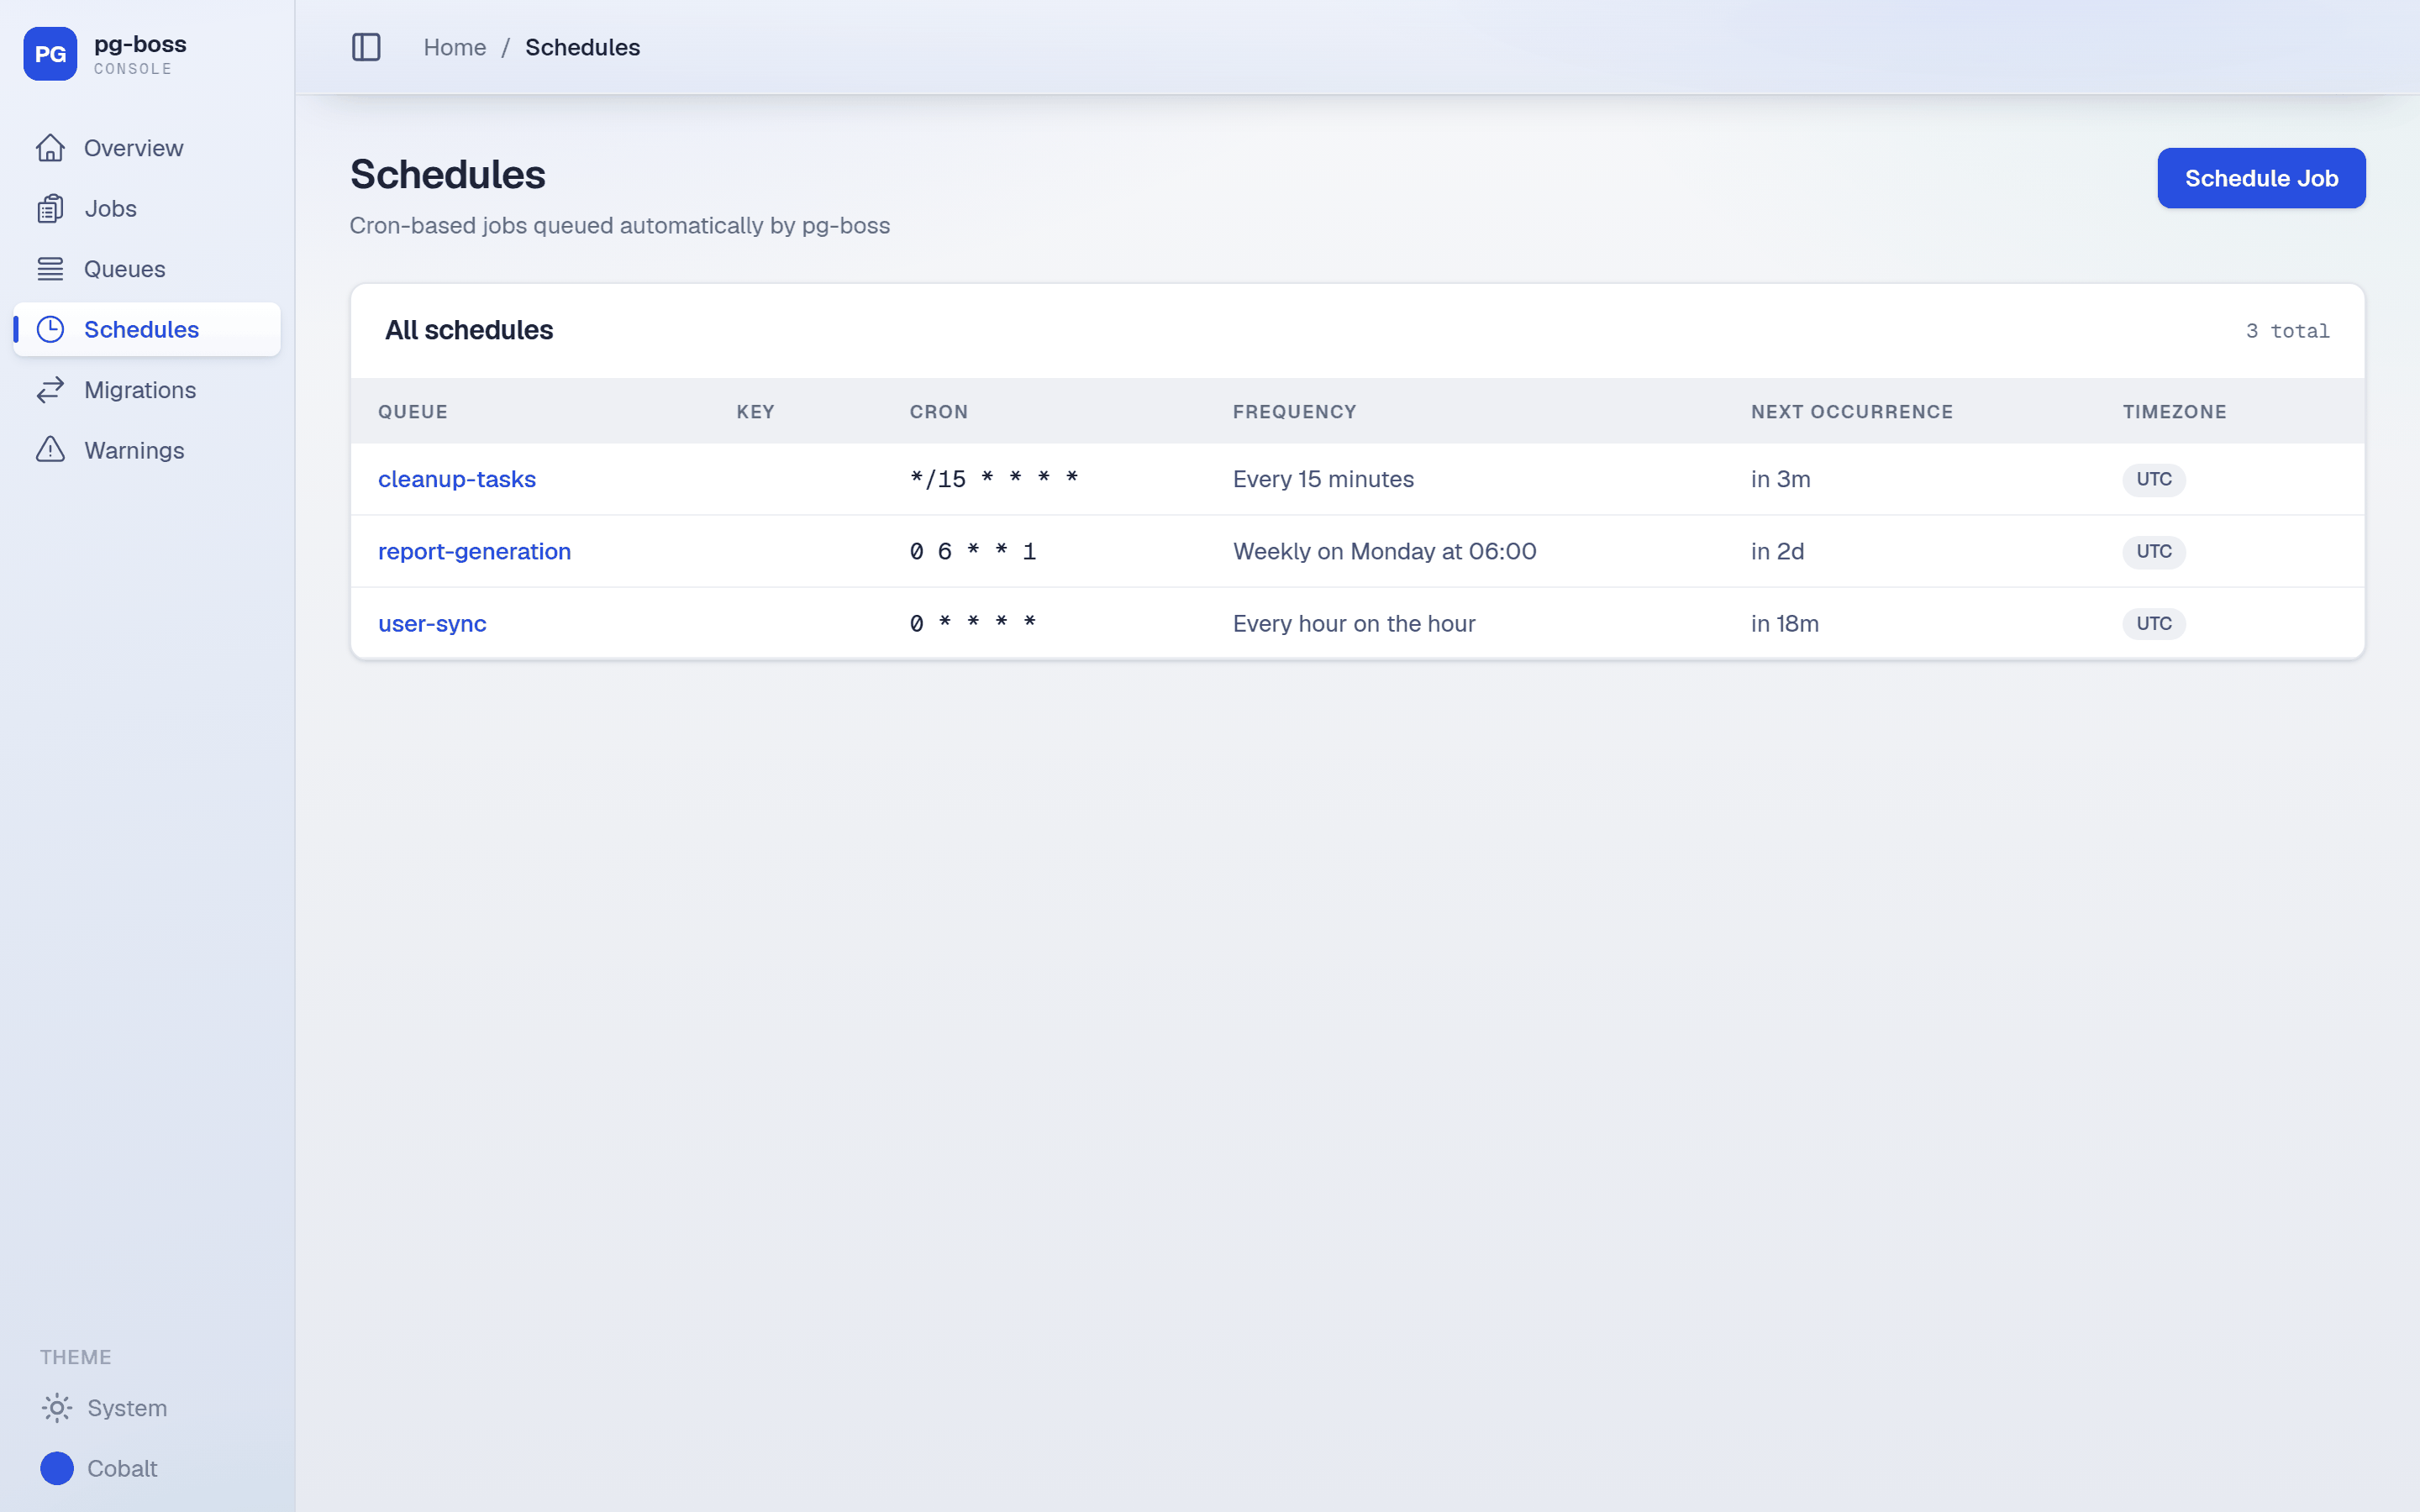
Schedules registered with boss.schedule(), showing the target queue, optional key, expression, a human-readable frequency, the next occurrence and timezone. Both schedule kinds are read through pg-boss itself, so a schedule stored as an RRULE is badged as one and gets the same next occurrence the scheduling pass will use. Schedule Job creates a new schedule from either a cron expression or a rule, with a missed occurrence policy, and each schedule's detail page shows its data, options, the last job it created and lets you unschedule it.
Migrations
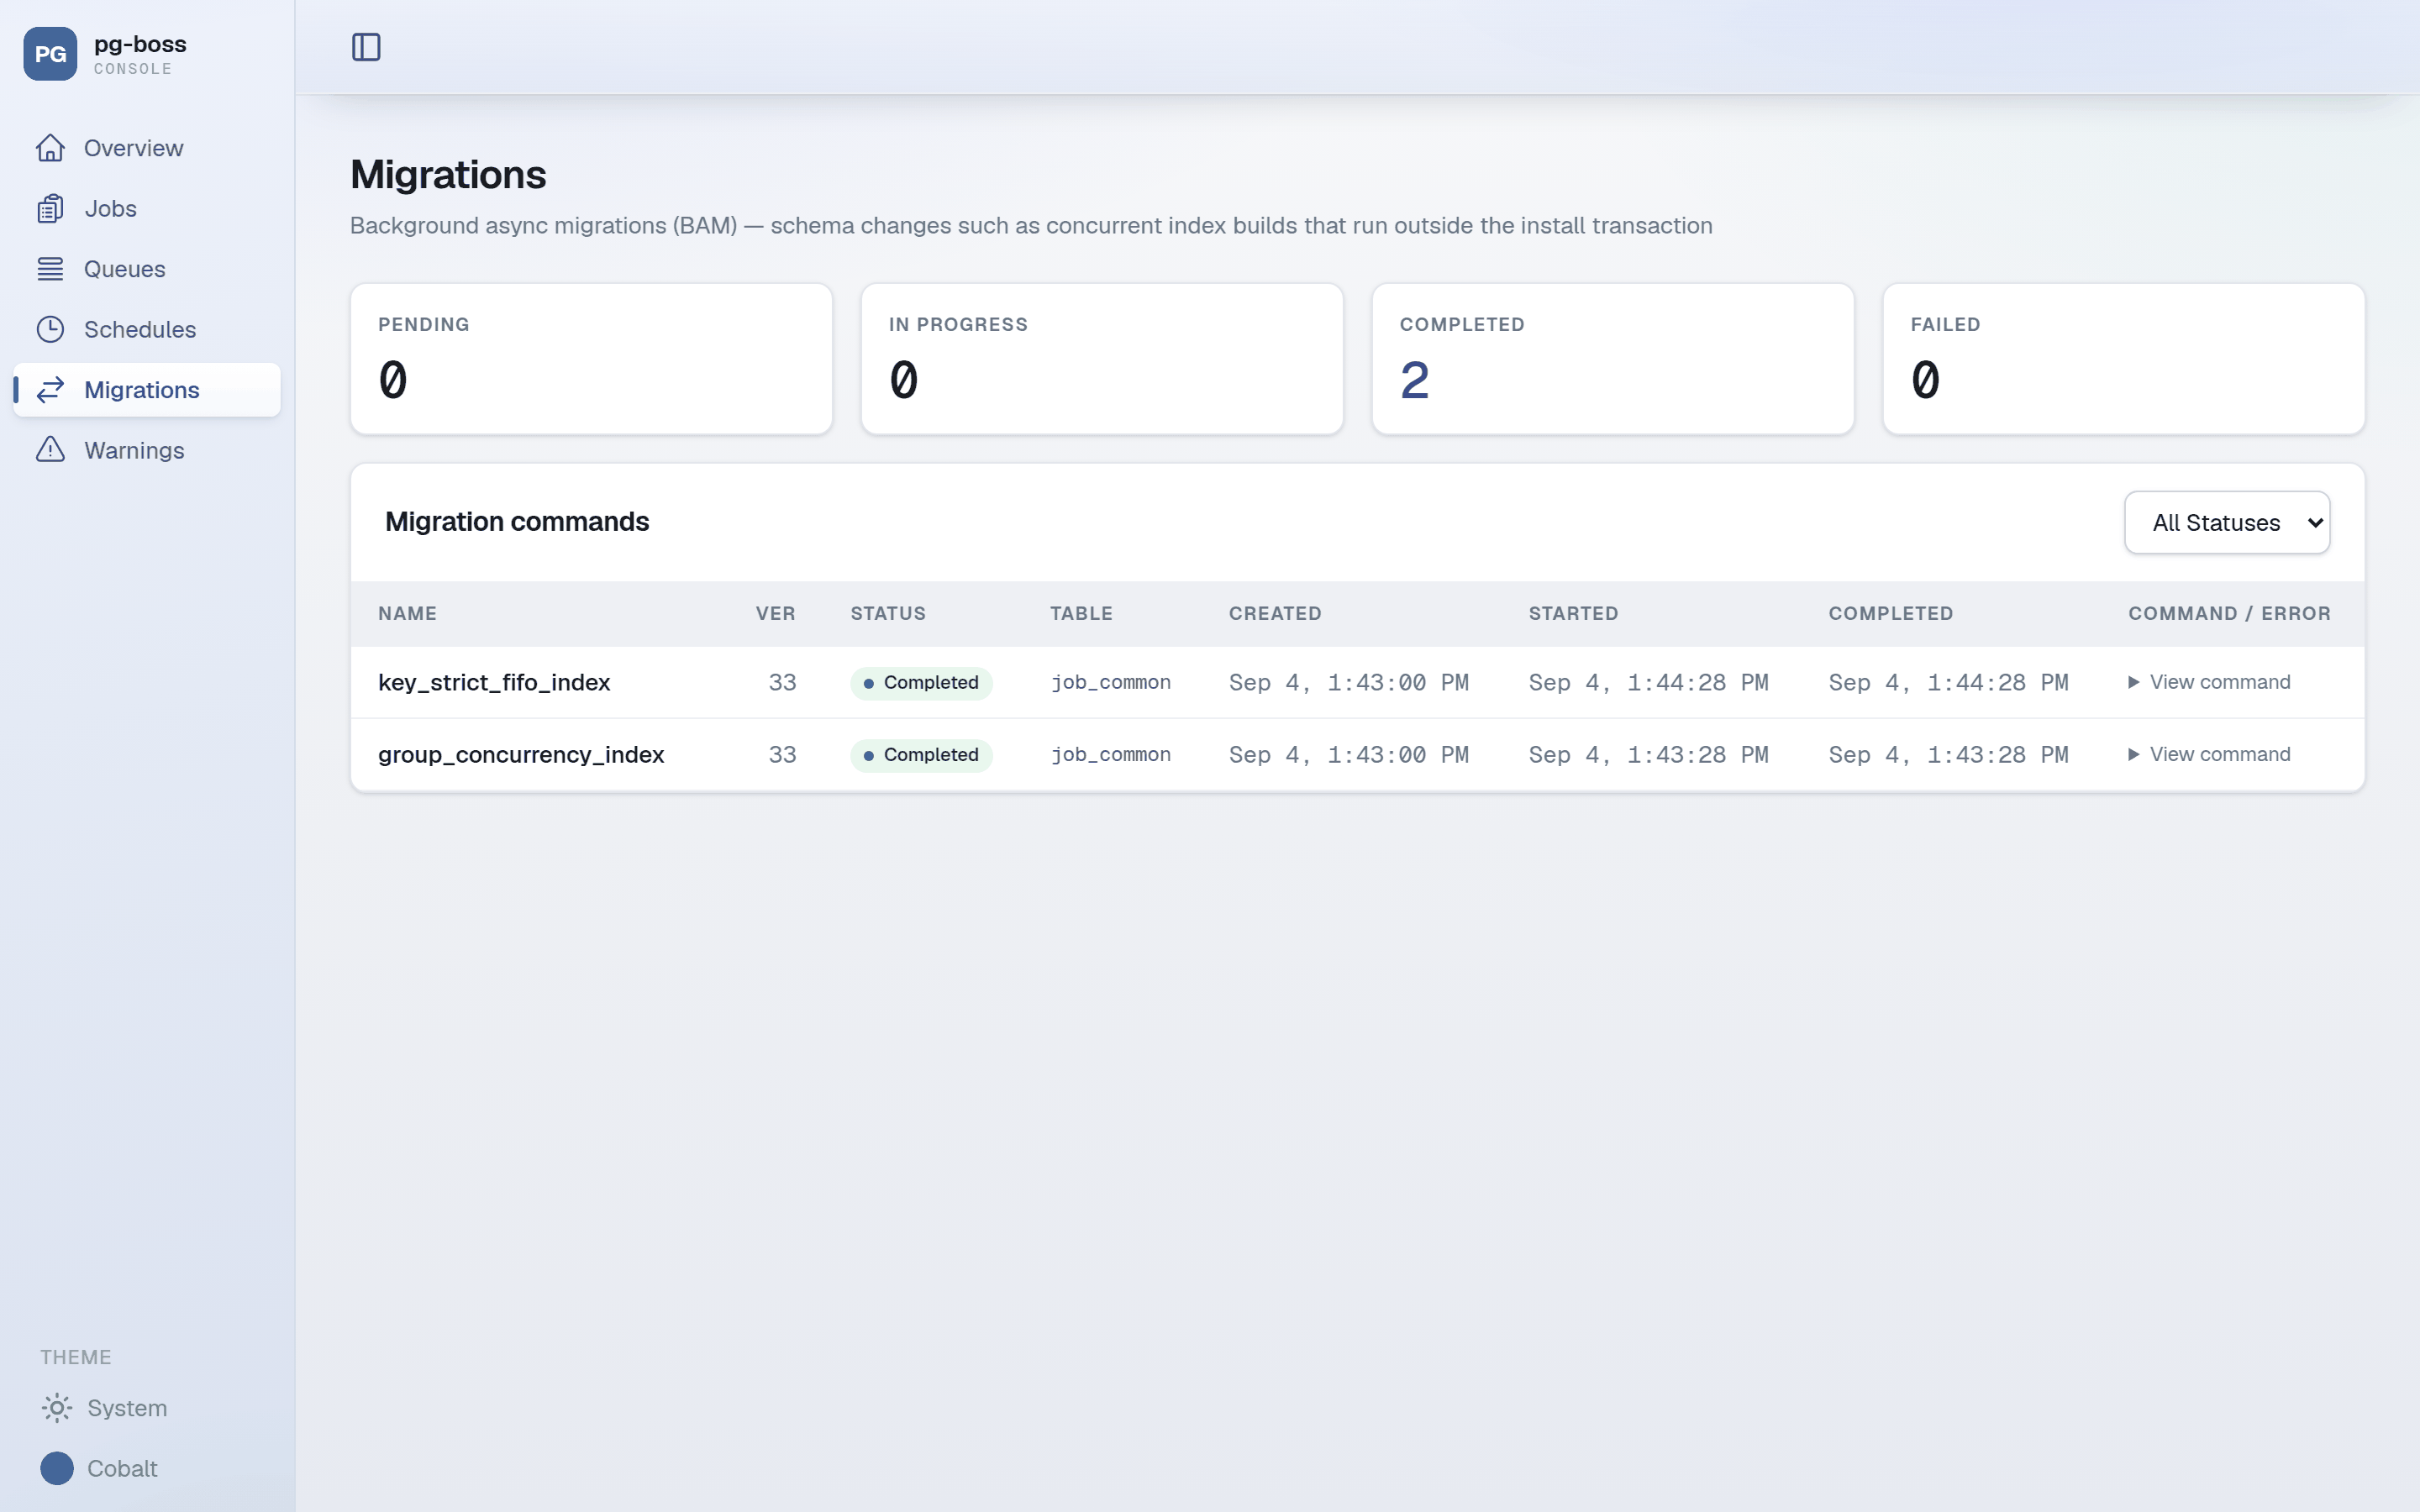
Status of background async migrations (BAM) — schema changes such as concurrent index builds that pg-boss runs outside the install transaction. Shows pending, in-progress, completed and failed counts, and for each command its version, target table, timestamps and the SQL that was (or will be) executed, including any error message.
Warnings
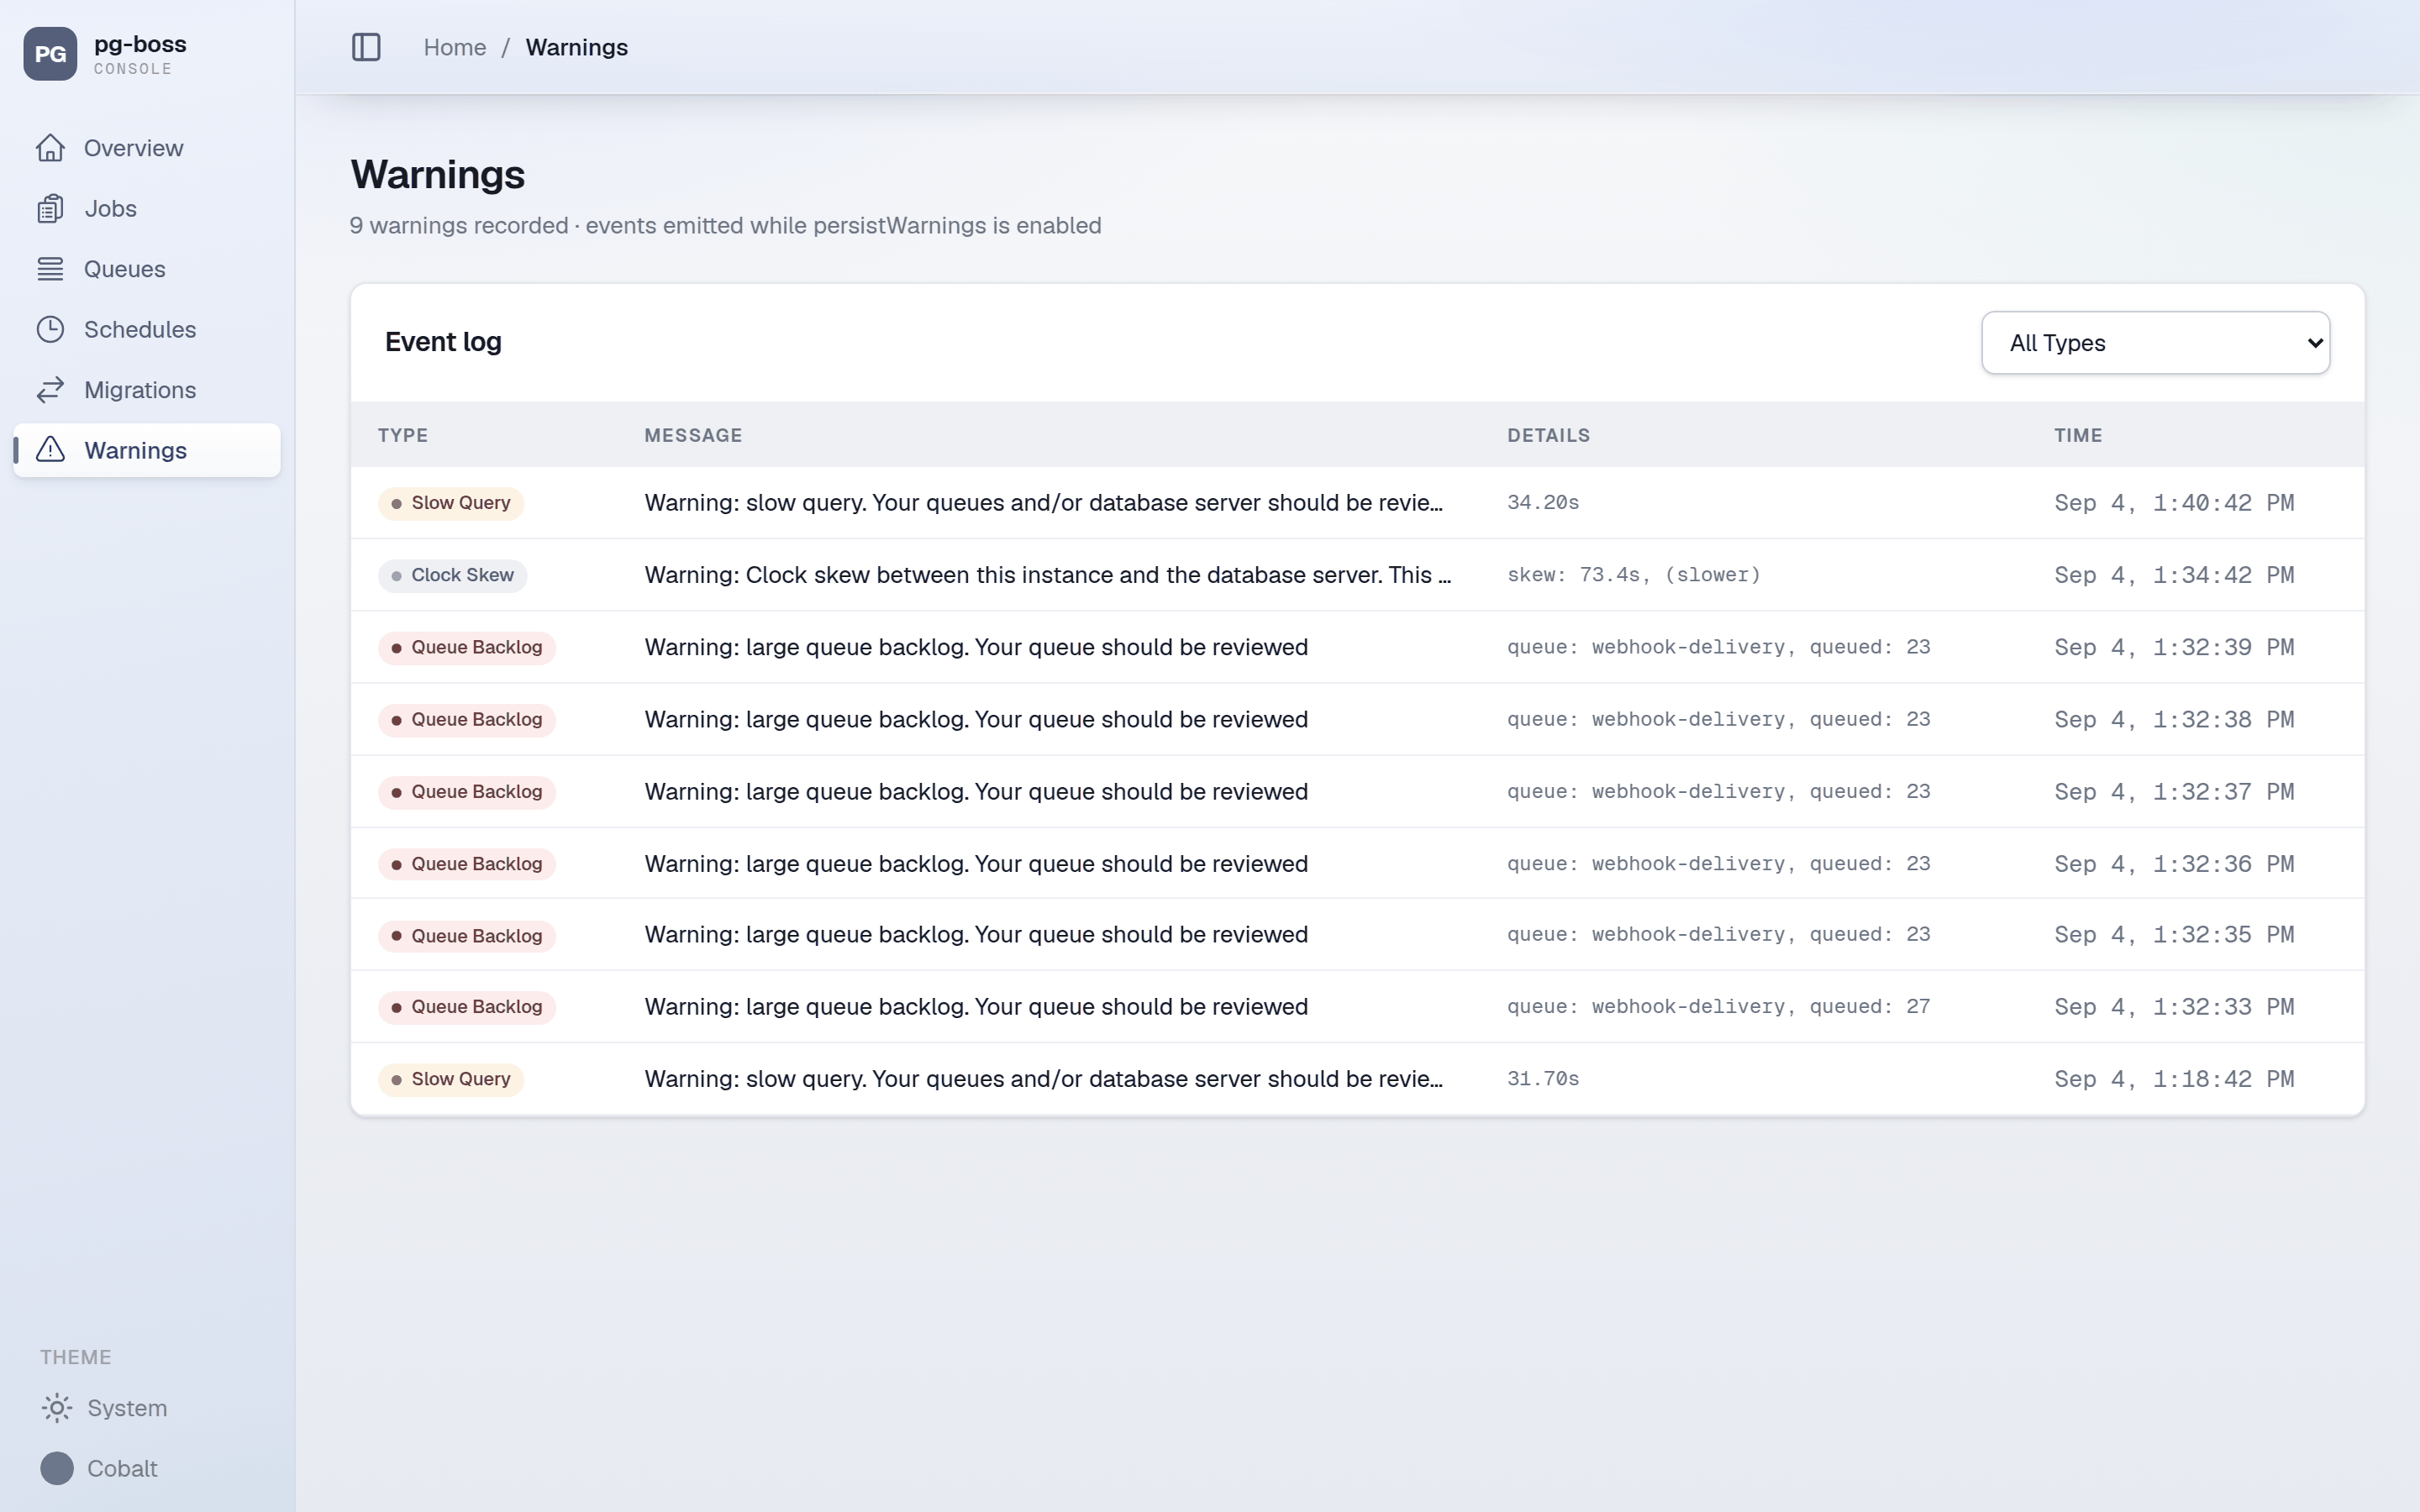
Event log of warnings emitted by pg-boss when persistWarnings is enabled, such as slow queries, queue backlogs or clock skew. Each entry shows its type, message, key details (for example the queue and its size, or the query duration) and time, and the list can be filtered by warning type.
Requirements
- Node.js 22.12+
- PostgreSQL database with pg-boss schema
- pg-boss 12.24+ recommended (12.21 minimum; queue metrics history and ready-count sparklines require 12.24)
Installation
npm install @pg-boss/dashboardQuick Start
For a quick local test:
DATABASE_URL="postgres://user:password@localhost:5432/mydb" npx pg-boss-dashboardOpen http://localhost:3000 in your browser.
Configuration
The dashboard is configured via environment variables:
| Variable | Description | Default |
|---|---|---|
DATABASE_URL | PostgreSQL connection string(s) | postgres://localhost/pgboss |
PGBOSS_SCHEMA | pg-boss schema name(s) | pgboss |
PORT | Server port | 3000 |
PGBOSS_DASHBOARD_AUTH_USERNAME | Basic auth username (optional) | - |
PGBOSS_DASHBOARD_AUTH_PASSWORD | Basic auth password (optional) | - |
PGBOSS_DASHBOARD_READ_ONLY | Set to 1 to disable every mutating action (see Read-only mode) | - |
PGBOSS_DASHBOARD_BASE_PATH | Sub-path to serve the dashboard under, e.g. /pgboss (build-time only, see Serving under a sub-path) | / |
PGBOSS_DASHBOARD_QUERY_TIMEOUT | Max milliseconds per dashboard query before server-side cancellation (statement_timeout). Requires a restart to change. | 60000 |
Basic Authentication
To protect the dashboard with basic authentication, set PGBOSS_DASHBOARD_AUTH_USERNAME and PGBOSS_DASHBOARD_AUTH_PASSWORD:
PGBOSS_DASHBOARD_AUTH_USERNAME=admin \
PGBOSS_DASHBOARD_AUTH_PASSWORD=secret \
DATABASE_URL="postgres://localhost/mydb" \
npx pg-boss-dashboard
Both variables must be provided together. If only one is set, the dashboard will throw an error on startup.
Read-only mode
Set PGBOSS_DASHBOARD_READ_ONLY=1 to serve the dashboard as a viewer:
PGBOSS_DASHBOARD_READ_ONLY=1 \
DATABASE_URL="postgres://localhost/mydb" \
npx pg-boss-dashboard
Every page still loads and every query still runs. What changes:
- The server rejects every non-
GET/HEADrequest with403, so sending, retrying, cancelling, resuming, deleting, creating queues, and scheduling are all refused — including a request crafted by hand. - The controls for those actions are not rendered, and
/send,/queues/create, and/schedules/newexplain themselves instead of showing a form.
This is a global switch rather than a permission system: everyone who can reach the dashboard sees the same read-only view. It is independent of basic authentication and can be combined with it.
Multi-Database Configuration
To monitor multiple pg-boss instances, separate connection strings with a pipe (|):
DATABASE_URL="postgres://host1/db1|postgres://host2/db2" npx pg-boss-dashboardYou can optionally name each database for better identification in the UI:
DATABASE_URL="Production=postgres://prod/db|Staging=postgres://stage/db" npx pg-boss-dashboardIf your databases use different schemas, specify them with matching pipe separation:
DATABASE_URL="postgres://host1/db1|postgres://host2/db2" \
PGBOSS_SCHEMA="pgboss|jobs" \
npx pg-boss-dashboard
When multiple databases are configured, a database selector appears in the sidebar. The selected database is persisted in the URL via the db query parameter, making it easy to share links to specific database views.
Production Deployment
Option 1: Direct Node.js
npm install @pg-boss/dashboard

DATABASE_URL="postgres://user:pass@localhost:5432/db" \
  node node_modules/@pg-boss/dashboard/build/server.js
Option 2: Docker
FROM node:24
WORKDIR /app
RUN npm install -g @pg-boss/dashboard
ENV PORT=3000
EXPOSE 3000
CMD ["pg-boss-dashboard"]docker build -t pgboss-dashboard .
docker run -d \
-e DATABASE_URL="postgres://user:pass@host:5432/db" \
-p 3000:3000 \
pgboss-dashboardOption 3: Docker Compose
services:
  dashboard:
    image: node:24
    working_dir: /app
    command: sh -c "npm install -g @pg-boss/dashboard && pg-boss-dashboard"
    environment:
      DATABASE_URL: postgres://user:pass@db:5432/mydb
      PGBOSS_SCHEMA: pgboss
      PORT: 3000
    ports:
      - "3000:3000"
    depends_on:
      - db
Reverse Proxy
For production, place a reverse proxy in front of any of the above options. Example Nginx configuration:
server {
    listen 80;
    server_name pgboss.example.com;

    location / {
        proxy_pass http://127.0.0.1:3000;
        proxy_http_version 1.1;
        proxy_set_header Host $host;
        proxy_set_header X-Real-IP $remote_addr;
        proxy_set_header X-Forwarded-For $proxy_add_x_forwarded_for;
        proxy_set_header X-Forwarded-Proto $scheme;
    }
}
Serving under a sub-path
By default the dashboard is served from the root path (/). To serve it under a sub-path (for example behind a reverse proxy at https://example.com/pgboss/), set PGBOSS_DASHBOARD_BASE_PATH at build time:
PGBOSS_DASHBOARD_BASE_PATH=/pgboss npm run build
PGBOSS_DASHBOARD_BASE_PATH=/pgboss npm start
This sets both the Vite asset base and the React Router basename, so assets, in-app navigation, and action redirects all stay under the prefix. The reverse proxy should forward the prefix unchanged (do not strip it):
location /pgboss/ {
    proxy_pass http://127.0.0.1:3000;
    proxy_http_version 1.1;
    proxy_set_header Host $host;
    proxy_set_header X-Real-IP $remote_addr;
    proxy_set_header X-Forwarded-For $proxy_add_x_forwarded_for;
    proxy_set_header X-Forwarded-Proto $scheme;
}
The asset base is baked in at build time, so the published npm package (which ships a prebuilt
build/) always uses/. To serve under a sub-path, build from source withPGBOSS_DASHBOARD_BASE_PATHset.
The dev server (
npm run dev) always serves from the root path;PGBOSS_DASHBOARD_BASE_PATHonly affects production builds.
Enabling Warning Persistence
To capture warnings in the dashboard, enable warning persistence in your pg-boss configuration:
const PgBoss = require('pg-boss');

const boss = new PgBoss({
  connectionString: 'postgres://localhost/mydb',
  persistWarnings: true  // Enable warning persistence
});
Warnings correlate to warning events already emitted by pg-boss:
slow_query: Queries taking longer than expectedqueue_backlog: Queues exceeding their warning thresholdclock_skew: Database clock drift detectionlisten_notify_unavailable:useListenNotifyis on but no listener could be establishedinvalid_schedule: A stored schedule could not be evaluated and was skippedindex_bloat: A job index holds far more pages than its live entries need and was not rebuiltxmin_horizon: Something is pinning the MVCC horizon, so vacuum reclaims nothingautovacuum_disabled: Nothing is vacuuming a job table at allmonitor_backoff: The queue-stats aggregate was deferred to keep autovacuum moving
A warning type written by a newer pg-boss core than the dashboard is displayed under its raw name.
Tech Stack
- Framework: React Router 8 (framework mode)
- Server: Hono
- Styling: Tailwind CSS v4
- Components: Base UI
- Database: pg (PostgreSQL client)
- Testing: Vitest + Testing Library
Troubleshooting
"Failed to load dashboard"
- Verify
DATABASE_URLis correct and the database is accessible - Ensure the pg-boss schema exists (run pg-boss at least once to create it)
- Check PostgreSQL logs for connection errors
No warnings showing
- Ensure
persistWarnings: trueis set in your pg-boss configuration - Warnings are only recorded after enabling this option
Queue stats seem stale
Queue statistics are cached in the queue table by pg-boss's monitoring system. They update based on your monitorStateIntervalSeconds configuration (default: 30 seconds).
Contributing
To work on the dashboard from source, see the package README.